 By thinkzone
Executive summary:
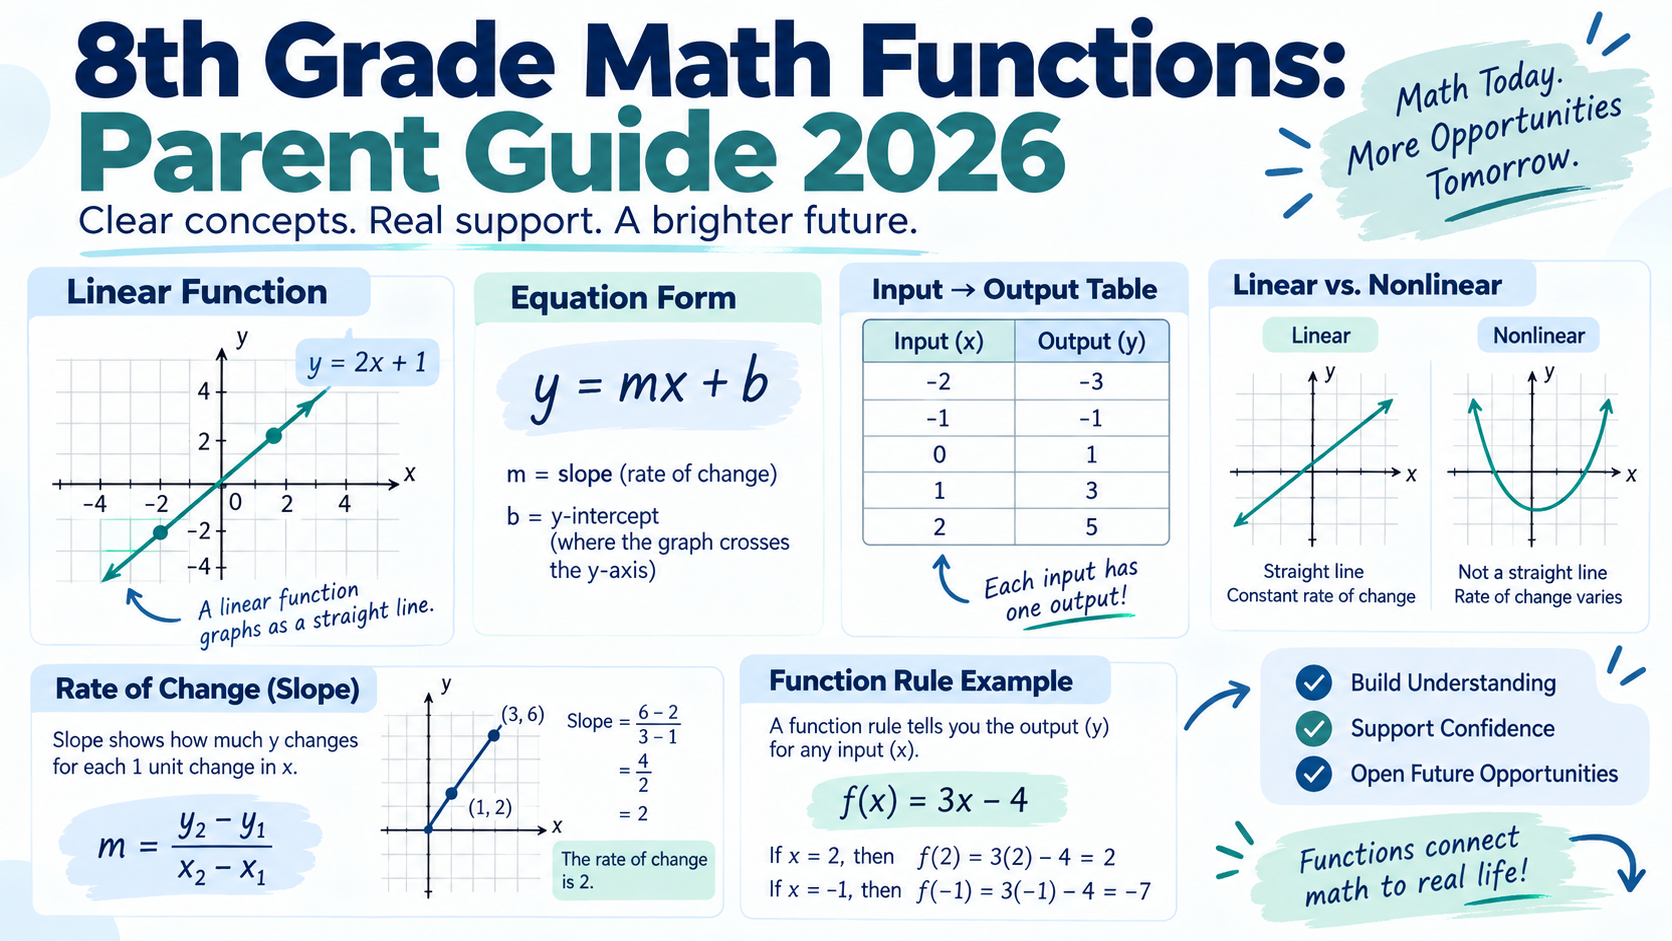
By the end of 8th grade, students working within Common Core–aligned standards should understand what makes a relationship a function, compare functions shown in different forms, recognize and model linear functions with (y=mx+b), find and interpret rate of change and initial value, and describe what a graph says about a relationship. These skills form a bridge from middle-school arithmetic and equations into the more formal study of functions in Algebra 1 and later high-school math.
What Is a Function, Exactly?
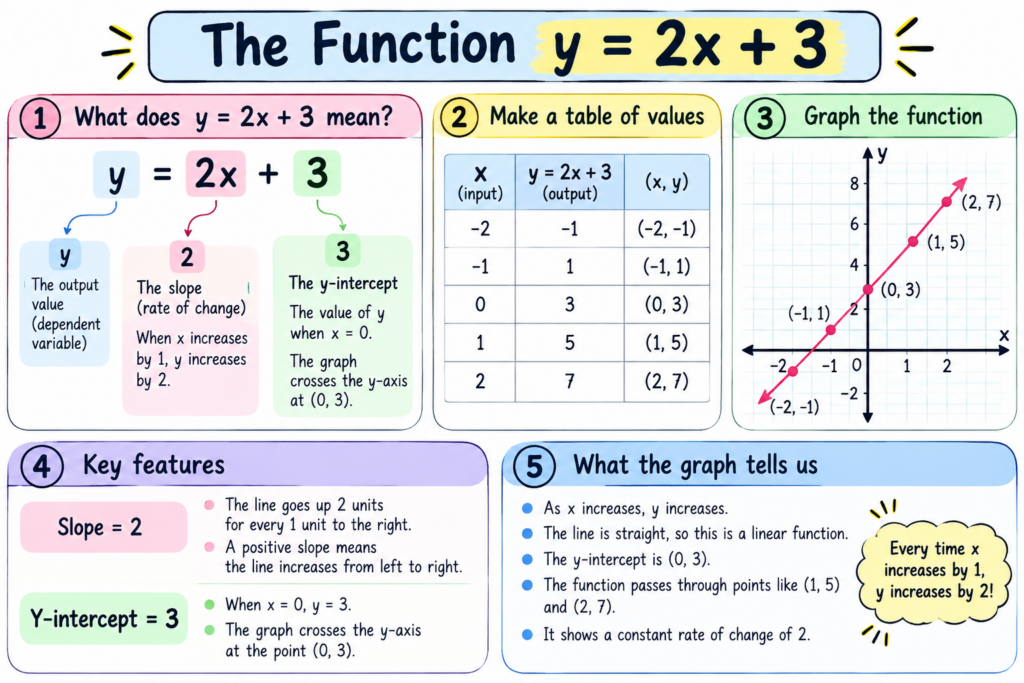
A function is a relationship in which every input has exactly one output. That is the most important definition for an 8th grader to remember.
Think of a function as a machine. Put one input into the machine, apply a rule, and the machine produces one result.
For example:
[ y=2x+3 ]
If (x=4):
[ y=2(4)+3=11 ]
The input 4 leads to exactly one output: 11.
A relationship stops being a function when the same input is connected to two different outputs. This is the central idea in Common Core standard 8.F.1. The standard also defines a function’s graph as the ordered pairs made from inputs and their corresponding outputs. Importantly, formal (f(x)) notation is not required in Grade 8 under Common Core, although some schools may introduce it early.
Here is a quick parent check:
| Input (x) | Output (y) |
|---|---|
| 1 | 5 |
| 2 | 7 |
| 3 | 9 |
This is a function because every input has one output.
But this is not:
| Input (x) | Output (y) |
|---|---|
| 1 | 5 |
| 2 | 7 |
| 2 | 10 |
The input 2 produces both 7 and 10.
Example problem: Is ({(1,4),(2,6),(3,8),(1,9)}) a function?
Solution: No. Input 1 is paired with both 4 and 9, so it violates the ‘one output for each input’ rule.
For parents, the deeper goal is not simply having a child memorize this definition. An 8th grader should begin recognizing the same relationship when it appears as an equation, table, graph, or verbal description. Common Core explicitly emphasizes moving among these representations.
How to Compare Two Functions (Table, Graph, or Equation)
A major 8th grade skill is comparing two functions even when they are presented differently. One may appear as an equation while another appears as a table, graph, or written situation. That ability is directly addressed by Common Core 8.F.2.
For linear functions, the easiest comparison strategy is usually to put both functions into the same mathematical language.
| Representation | What to look for | How to compare |
|---|---|---|
| Equation | Coefficient of (x) and constant term | Identify rate of change and initial value |
| Table | Repeated change in (y) compared with change in (x) | Calculate (\Delta y/\Delta x) |
| Graph | Steepness and where the line crosses the y-axis | Read slope and initial value |
| Description | ‘per,’ ‘each,’ ‘starts with,’ ‘initial fee’ | Translate the words into rate and starting value |
Suppose Function A is:
[ y=3x+4 ]
Function B is shown in a table:
| (x) | (y) |
|---|---|
| 0 | 1 |
| 1 | 5 |
| 2 | 9 |
| 3 | 13 |
To compare their rates of change:
- For Function A, read the coefficient of (x): the rate is 3.
- For Function B, calculate ((5-1)/(1-0)=4).
- Compare the rates: (4>3).
- Therefore, Function B has the greater rate of change.
Example problem: Which grows faster: (y=5x+2), or a function whose output increases from 7 to 19 while the input increases from 1 to 4?
Solution: The first function has a rate of 5. For the second,
[ m=\frac{19-7}{4-1}=\frac{12}{3}=4 ]
So the first function grows faster.
This ability to translate between representations matters beyond one homework unit. The Institute of Education Sciences’ evidence-based algebra guidance emphasizes understanding algebraic structure rather than relying only on procedures, while NCTM’s Grades 6–8 expectations include connecting symbolic expressions with graphs and modeling situations using graphs, tables, and equations.
Understanding Linear Functions: y = mx + b
One of the most important equations in 8th grade math is:
[ \boxed{y=mx+b} ]
In this form:
- (x) is the input.
- (y) is the output.
- (m) is the slope, or constant rate of change.
- (b) is the initial value, which is the value of (y) when (x=0).
Common Core 8.F.3 specifically expects students to interpret (y=mx+b) as a linear function whose graph is a straight line and to distinguish linear functions from nonlinear ones.
Consider:
[ y=2x+5 ]
The 5 means the relationship starts at 5 when (x=0). The 2 means that every time (x) increases by 1, (y) increases by 2.
A simple graph looks like this:
   y
13 |             *
11 |          *
 9 |       *
 7 |    *
 5 | *
   +---------------- x
     0  1  2  3  4
The points lie on a straight line because the rate of change remains constant.
A function does not have to be linear to be a function. For example, (y=x^2) still gives one output for each input, but its graph curves rather than forming a straight line. The Common Core standards use this kind of example to distinguish ‘function’ from ‘linear function.’
A useful parent question is therefore not just, ‘Can my child plug numbers into (y=mx+b)?’ Ask instead:
‘Can you tell me what the 2 and 5 mean in a real situation?’
Being able to interpret the equation is stronger evidence of understanding than merely substituting values.
Finding Rate of Change and Initial Value
Rate of change tells you how much the output changes when the input changes. Initial value tells you where the relationship starts when the input is zero.
For a linear function, rate of change is:
[ m=\frac{\text{change in }y}{\text{change in }x} =\frac{y_2-y_1}{x_2-x_1} ]
Common Core 8.F.4 expects 8th graders to determine both rate of change and initial value from descriptions, ordered pairs, tables, or graphs—and to explain what those values mean in context.
Suppose a tutoring app tracks points with this table:
| Hours practiced (x) | Points (y) |
|---|---|
| 1 | 18 |
| 2 | 26 |
| 3 | 34 |
| 4 | 42 |
To find the function:
- Find the change in output: (26-18=8).
- Find the change in input: (2-1=1).
- Divide: (8/1=8), so (m=8).
- Work backward to (x=0): since the value rises by 8 each hour, the value before hour 1 was (18-8=10).
- Therefore, (b=10).
The equation is:
[ \boxed{y=8x+10} ]
Example problem: A bike rental costs $12 to start plus $6 per hour. Write a linear function.
Solution: The initial value is 12 and the rate of change is 6:
[ \boxed{y=6x+12} ]
In context, 12 represents the starting fee and 6 represents the additional dollars charged per hour.
This contextual interpretation is exactly the kind of connection 8.F.4 is designed to develop.
Reading a Function’s Story From Its Graph
By 8th grade, a graph should become more than a picture students use to locate coordinates. Students should be able to describe what is happening in the situation represented by the graph.
Common Core 8.F.5 asks students to identify features such as where a function is increasing or decreasing and whether its behavior is linear or nonlinear. Students should also be able to sketch a graph from a verbal description.
Consider this simplified graph:
Distance
  ^
  |             /\
  |            /  \
  |      _____/    \
  |     /
  |    /
  +--------------------> Time
A student should be able to tell a story such as:
First: distance increases, so the person is moving away.
Next: the graph is flat, so the distance does not change.
Then: distance increases again.
Finally: distance decreases, suggesting the person is moving back toward the starting point.
The important question is not simply, ‘What is the y-value at (x=4)?’ It is also:
‘What does the shape of this graph tell us about the relationship?‘
That interpretive skill continues into high school, where students analyze intercepts, increasing and decreasing intervals, rate of change, maximums, minimums, and other graph features.
For parents checking understanding at home, try showing your child a graph without an equation and asking them to explain what could be happening. Then reverse the task: describe a situation and ask them to sketch its likely graph.
Why Functions Matter for Algebra 1 and Beyond
Functions are one of the clearest bridges between 8th grade math and high-school algebra.
In Grade 8, students learn to recognize functions, compare different representations, understand linear functions, interpret rate of change and initial value, and read relationships from graphs. Under Common Core’s high-school Functions standards, those ideas expand into formal function notation, domain and range, average rate of change, more detailed graph analysis, and comparisons among broader families of functions.
In California’s Algebra I standards, students move beyond linear models to compare linear and exponential relationships, including recognizing constant additive change versus constant multiplicative change.
That progression can be visualized like this:
Mermaid production request: Render this as a simple horizontal ‘Function-to-Algebra Relationship’ timeline for the published article. On mobile, switch it to a vertical flow. The diagram should emphasize that Grade 8 function work is a foundation for, rather than the full content of, Algebra 1; exact course sequencing can vary by state and district. The progression shown above reflects Common Core and California standards rather than every U.S. curriculum.
A useful readiness check is whether your child can take one simple linear relationship and explain it four ways: with words, a table, an equation, and a graph. That aligns closely with the representational understanding emphasized in Grade 8 standards and by NCTM.
When a student can perform a procedure but struggles to connect those representations, the issue may be more specific than simply being ‘bad at algebra.’ Think Zone’s current math program states that it uses an adaptive assessment to identify mastered skills, gaps, and appropriate next steps across K–Grade 8 mathematics before building a personalized learning plan. A natural internal CTA here is [schedule a math assessment → Assessment page], followed by [explore Think Zone’s personalized math program → Math Program page].
FAQ
What functions should an 8th grader know?
Under Common Core, an 8th grader should understand that each input of a function has exactly one output; compare functions represented by equations, graphs, tables, or descriptions; understand linear functions in the form (y=mx+b); determine rate of change and initial value; and describe relationships by reading or sketching graphs.
Does an 8th grader need to know (f(x)) notation?
Not necessarily. Common Core explicitly notes that function notation is not required in Grade 8. Schools may still introduce it as preparation for Algebra 1 or other high-school coursework.
How can you tell whether a table represents a function?
Check every input value. If each input has exactly one corresponding output, the relationship is a function. Two different inputs are allowed to have the same output; the problem occurs when one input has two different outputs.
What is the difference between a linear and nonlinear function?
A linear function has a constant rate of change and graphs as a straight line; (y=mx+b) is the standard Grade 8 form. A nonlinear function does not graph as a single straight line. Both types can still be functions as long as every input has one output.
What is the most important function skill before Algebra 1?
There is not one universal prerequisite because course sequences vary, but a particularly valuable foundation is being able to connect a relationship across equations, tables, graphs, and words while interpreting rate of change and initial value. That skill appears directly in Grade 8 standards and aligns with evidence-based algebra instruction emphasizing understanding mathematical structure rather than memorizing isolated procedures.
How can I tell whether my child has a gap in functions?
Ask your child to explain a simple function rather than only solve one. For example: ‘What does the slope mean?’, ‘Where is the starting value?’, ‘How would this equation look as a graph?’, or ‘Which of these two functions changes faster?’ Difficulty translating between representations can help identify where further review may be useful. For Think Zone, place the final internal CTA here: [find a Think Zone learning center near you → Location page]. Think Zone currently operates its math program through Bay Area centers and describes assessment as the starting point for identifying a student’s current level and next steps.